
Overview
BBProductive is a gamified productivity app cum task manager. It provides CRUD functionalities for tasks and offers a built-in Pomodoro that helps a user focus on work at regular intervals. BBProductive also offers a virtual pet that grows along with the user’s productivity.
Summary of contributions
-
Code contributed: [View on RepoSense]
-
Major enhancement: Added the ability for the user to track their app usage.
-
What it does: Generates data for the user to view in the statistics tab. Firstly, it displays the Daily Challenge, which tracks the total time the user ran the Pomodoro on the current day in an aesthetic progress bar. Secondly, it contains 2 bar graphs that track the number of tasks done and the total duration the user runs the Pomodoro for the past 7 days.
-
Justification: The user can keep track of their progress for the day as well as over the past week, and make necessary adjustments to ensure that they maintain their productivity.
-
Highlights: This implementation was challenging as the data structure for storing this information had to be well considered. I want to keep track of data only in the past n (7) days while accounting for usage across different days. I defined the CustomQueue data structure to store the data while enforcing table constraints to minimise memory usage and provide ease of use for the data to be displayed. Non-trivial storage classes and helper methods to access and update CustomQueue had to be defined as well.
-
-
Other contributions:
-
Project management:
-
Managed release
v1.2.1on GitHub.
-
-
Enhancements to existing features:
-
Documentation:
-
Updated documentation for Add Feature, Switch Tab Feature, Statistics Feature, User Stories and Non-Functional Requirements in Developer Guide.
-
Updated documentation for GUI, Statistics and Storage in User Guide.
-
-
Community:
-
Collaborate with teammates to tie in non-trivial features: [#123]
-
PRs reviewed (with non-trivial review comments): [#311] [#85] [#147]
-
Reported bugs and suggestions for other teams in the class: [link to issues]
-
-
Contributions to the User Guide
Given below are sections I contributed to the User Guide. They showcase my ability to write documentation targeting end-users. |
Graphical User Interface (Permas)
This section gives you a brief overview of the various GUI components present in BB Productive.
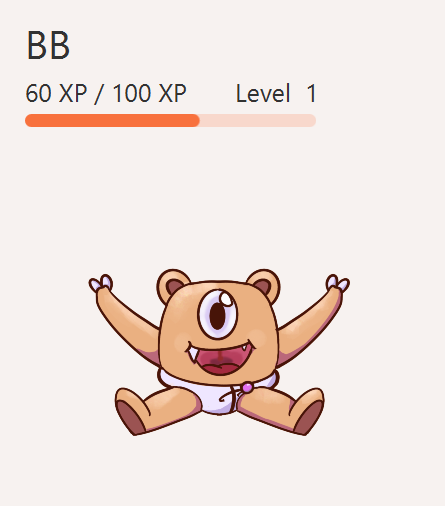
Pet View
The Pet View is where you can view your pet, its name, level, and experience points. With diligent usage of BB Productive, you can increase the experience points of your pete. The pet will evolve as it levels up, encouraging you to work harder! Further details of the Pet can be found in Section 6.2. Pet.
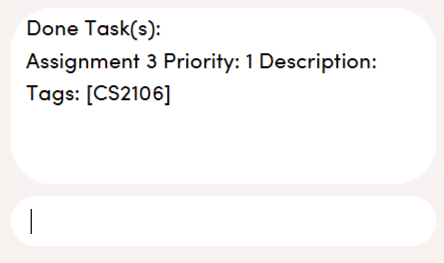
Command Box
The Command Box is the one-stop place for you to input any commands to interact with the app. Simply click the box and type the command of your choice. Hit [Enter] on your keyboard to execute the command. The program will respond to each command through the Pet Dialog Box. Occasionally, the app may also prompt you for your response via the Dialog Box. You can reply through the command box as well.
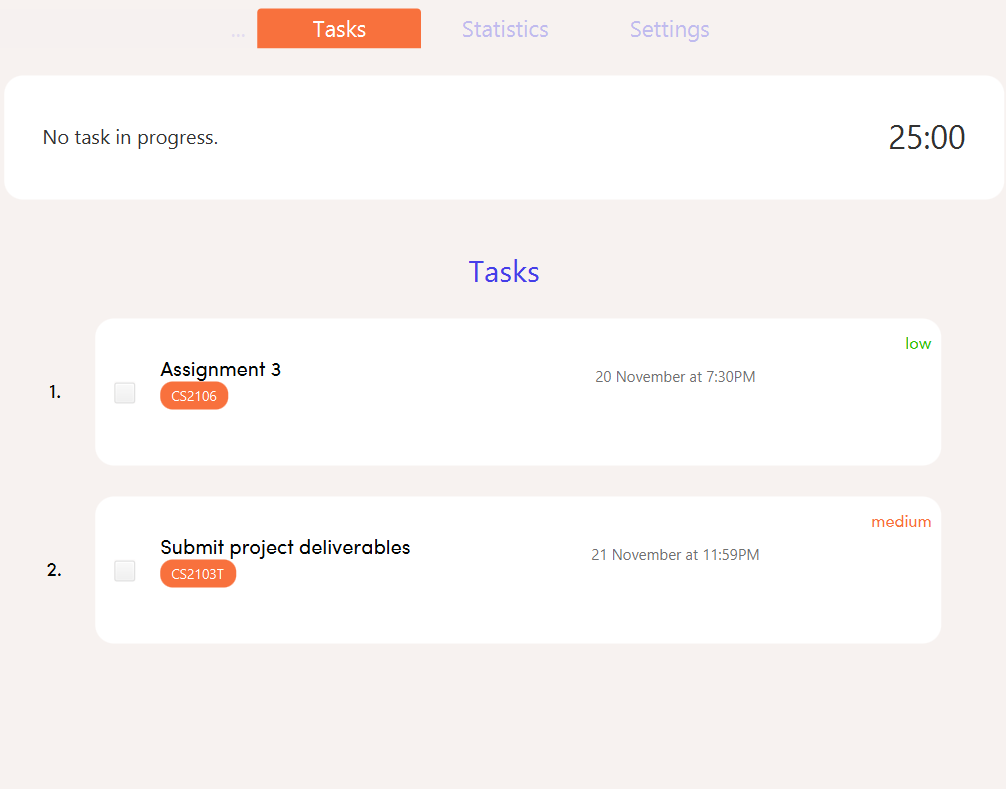
Tasks Tab
The Task Tab is where you can view your task list and the Pomodoro Timer. Any changes made to the task list through the commands will be reflected here! The Pomodoro Timer activates when you run the Pom Command as described in Section 6.3. Pomodoro.
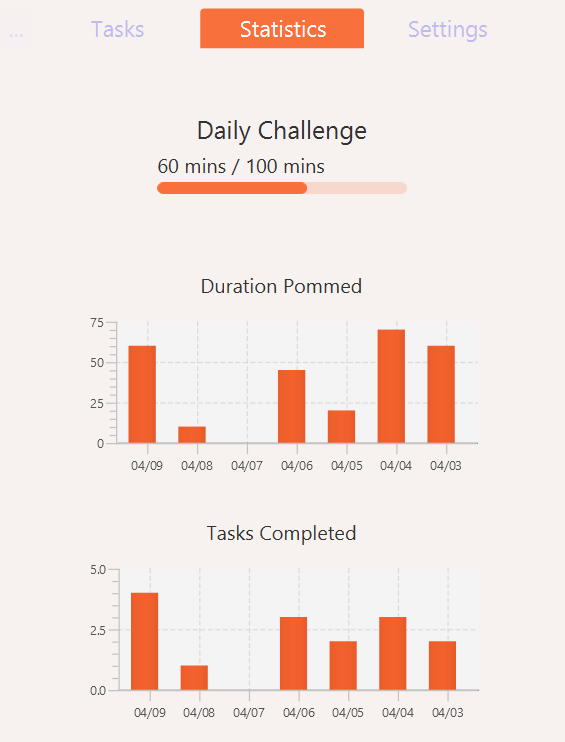
Statistics Tab
The Statistics Tab shows you your progress on the Daily Challenge and your Productivity Charts. They help you to visualize your productivity over the past week, so that you can reflect on your progress to hit your productivity goals! You can find out more about this tab in Section 6.4. Statistics.
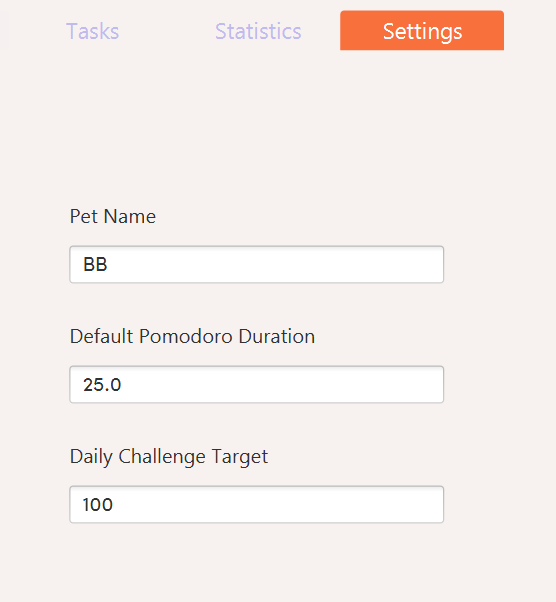
Settings Tab
The Settings Tab lets you customize the app to your preference. In this tab, you can view your configurations for Pet Name, Pomodoro Duration, and Daily Challenge Target. To find out more about how you can use this tab, head to Section 6.11. Set Commands.
Statistics (Permas)
As you continue to use BB Productive, you may start to wonder how productive you have been over time. This is where our Statistics feature comes in! Simply type in the command stats to access the Statistics Tab and track your productivity. Look out for the background color of the "Statistics" Tab. If it turns orange after you run the command, you are on the correct tab.
The Statistics Tab consists of two features to help you keep track of your productivity : the Daily Challenge and the productivity charts.
Daily Challenge
The Daily Challenge tracks the total duration you have completed with the Pomodoro running on the current day. The more you run the Pomodoro, the more the progress bar fills, and the closer you are to clearing the challenge! Try to clear the Daily Challenge every day to hit your productivity goals!
|
You can customize the duration you aim to achieve on a daily basis by using the Set Command as described in Section 6.11 Set Commands. |
Productivity Charts
The Productivity Charts tracks two main data points daily. Firstly, it tracks the number of tasks you have completed. Secondly, it tracks the total duration you ran the Pomodoro. With this information, you can gauge your productivity over time and make proper adjustments to your schedule to improve your productivity. If you start noticing the orange bars getting shorter, realize that it is time to buckle up and work harder, or else you may lose your productivity momentum!
Storage (Permas)
This section describes how you can transfer saved data.
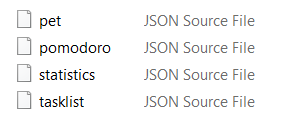
All your progress, user preferences and settings are stored in the “data” folder. If you plan to switch devices, you may transfer your progress to another computer by copying the contents of the original device’s “data” folder to the new device’s data folder. This can be done through a thumb drive.
Please check that the following files are in the “data” folder to ensure that you are transferring the correct files!
Contributions to the Developer Guide
Given below are sections I contributed to the Developer Guide. They showcase my ability to write technical documentation and the technical depth of my contributions to the project. |
UI component
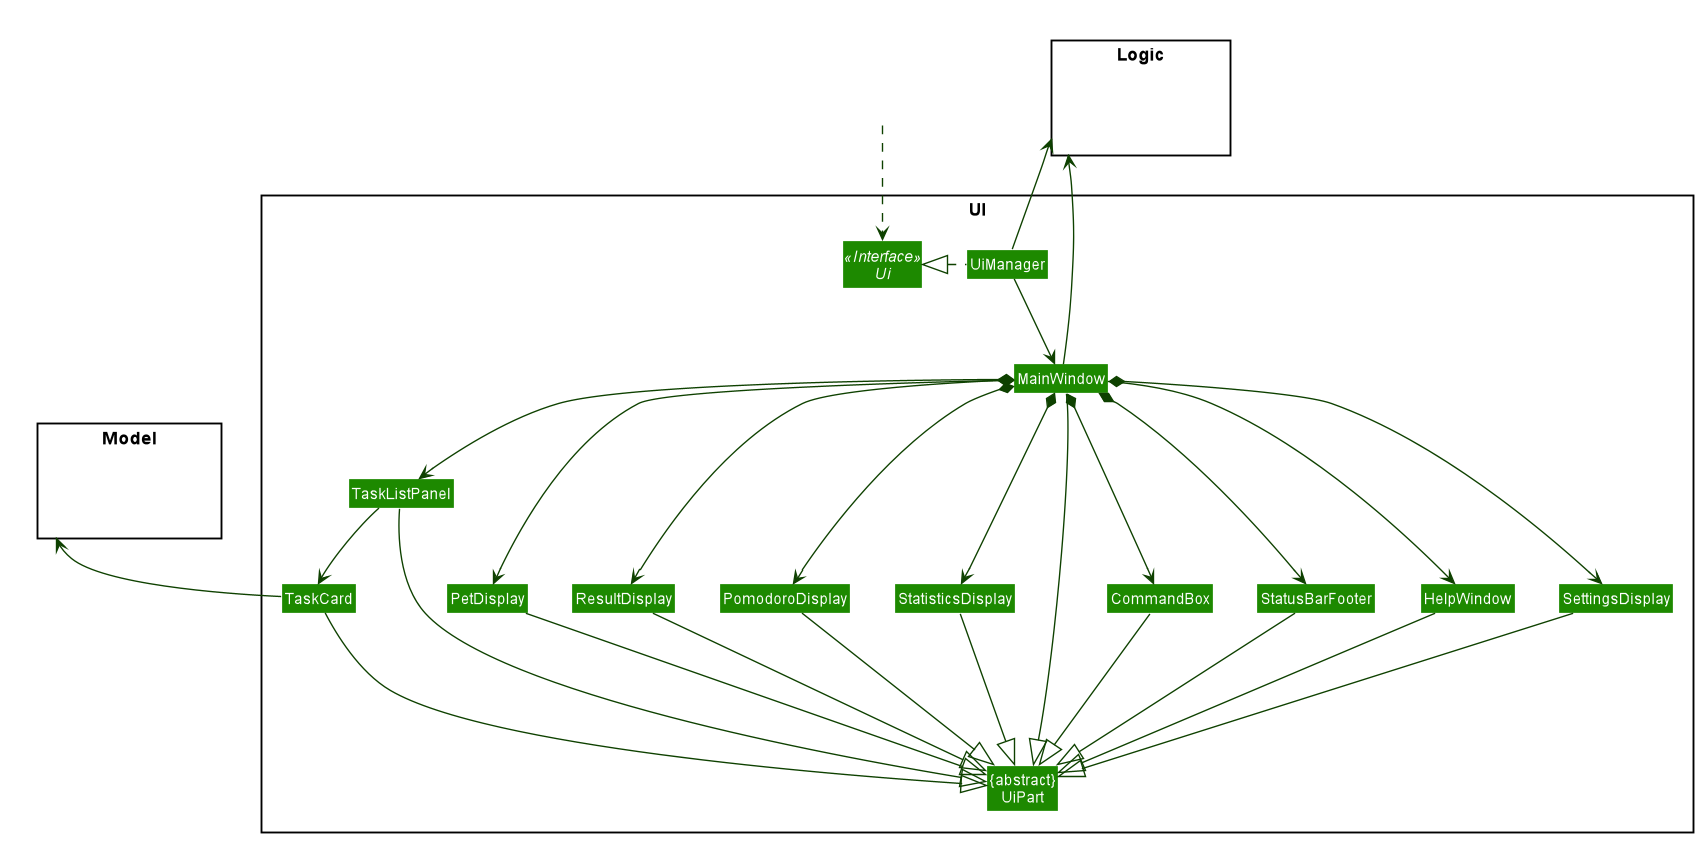
API : Ui.java
The UI consists of a MainWindow that is made up of parts e.g.CommandBox, ResultDisplay, PomodoroDisplay, StatisticsDisplay, PetDisplay etc. All these, including the MainWindow, inherit from the abstract UiPart class.
The UI component uses JavaFx UI framework. The layout of these UI parts are defined in matching .fxml files that are in the src/main/resources/view folder. For example, the layout of the MainWindow is specified in MainWindow.fxml
The UI component,
-
Executes user commands using the
Logiccomponent. -
Listens for changes to
Modeldata so that the UI can be updated with the modified data.
Add
Implementation
The Add feature allows the user to add a Task. Its only compulsory field is Name. Description, Priority, Reminder, Recurring and Tag are optional fields.
Default Priority of 'low' is assigned if it is not specified.
|
| The user can specify multiple `Tag`s. |
The mechanism of how SwitchTabCommand updates the Ui is described below through an example usage.
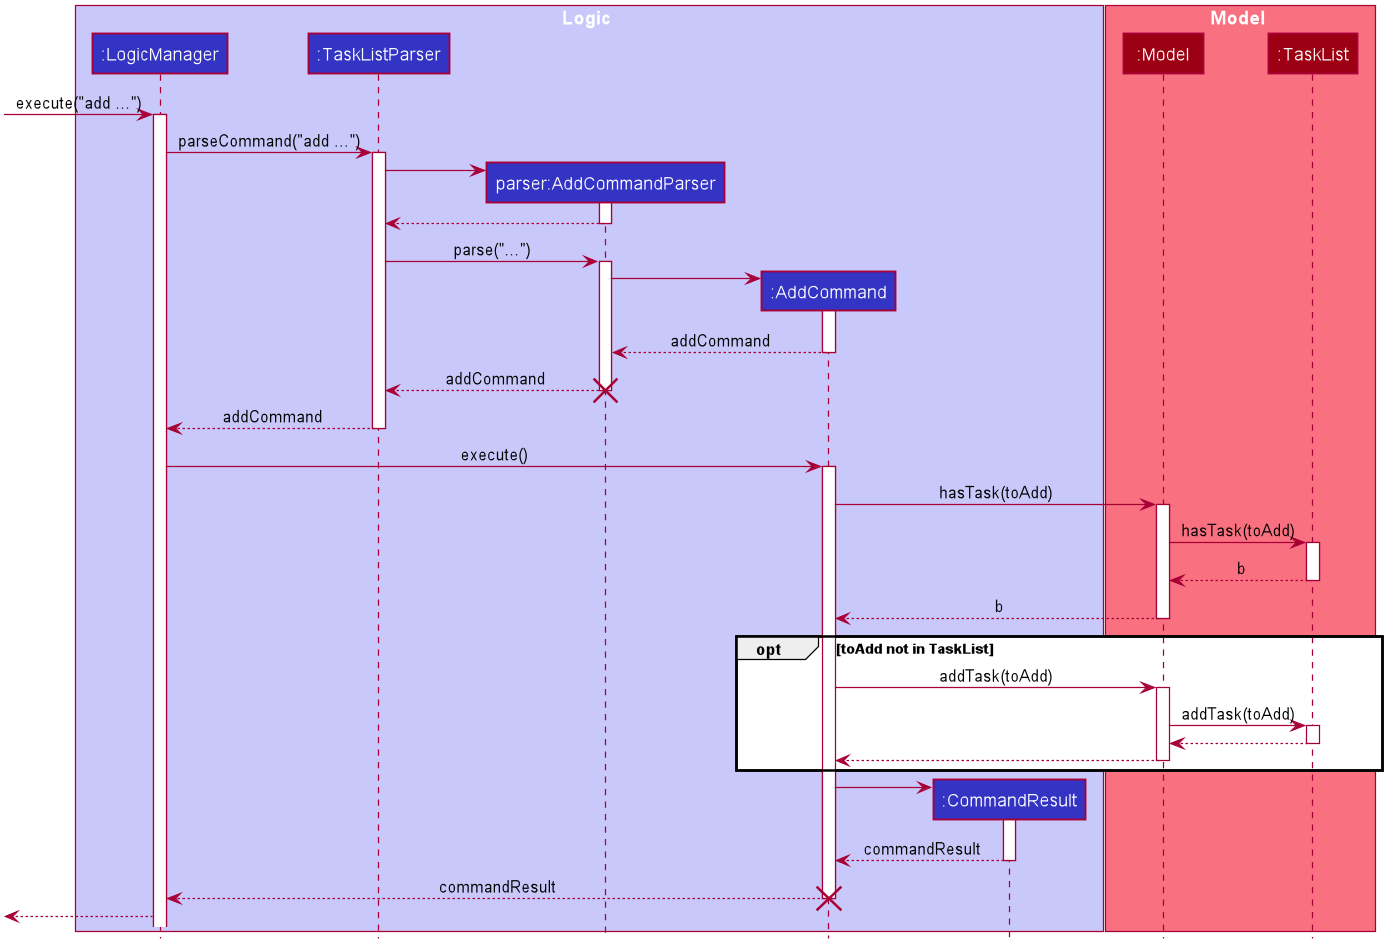
Step 1. The user executes add n/Homework 1 des/Read up on Semaphotes p/3 to add a new Task. LogicManager calls execute on this inputs.
Step 2. TaskListParser creates an AddCommandParser to parse this input. AddCommandParser creates the relevant objects for the fields specified in input. Based on the input, it creates a Task with its assigned Name, Priority and Description.
Step 3. AddCommandParser returns a new AddCommand with the newly created Task as its only argument to LogicManager.
Step 4. AddCommand executes. It checks if the TaskList contains a duplicate Task to it through Model#hasTask. If a duplicate Task exists, a CommandException is thrown. If not, it adds the new Task into the Tasklist through Model#addTask.
Step 5. AddCommand creates and return the resulting CommandResult to the Ui.
The following sequence diagram shows how the AddCommand is executed.
The following activity diagram summarises what happens when the AddCommand is executed.
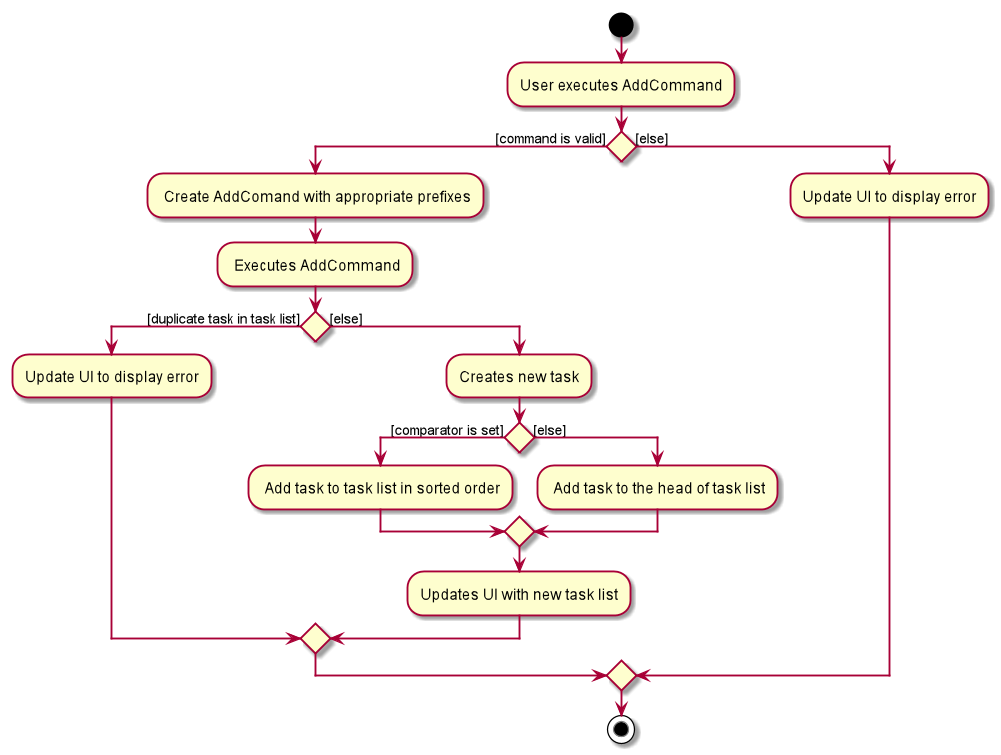
Switch Tab Feature
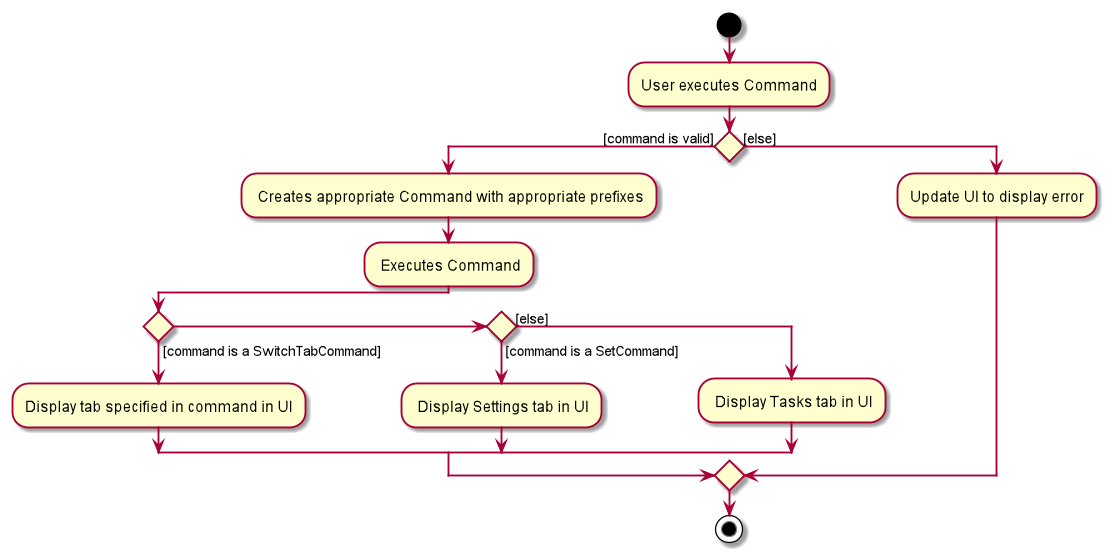
The Switch tab feature allows the user to traverse between the Tasks, Statistics and Settings tabs.
The user can switch tabs through 2 main methods:
1. User calls a valid SwitchTabCommand that displays the appropriate tab defined.
2. User calls a valid command that changes the display of Tab B while he or she is on Tab A. In this scenario, Tab B will display automatically.
This behaviour is represented in the following activity diagram.
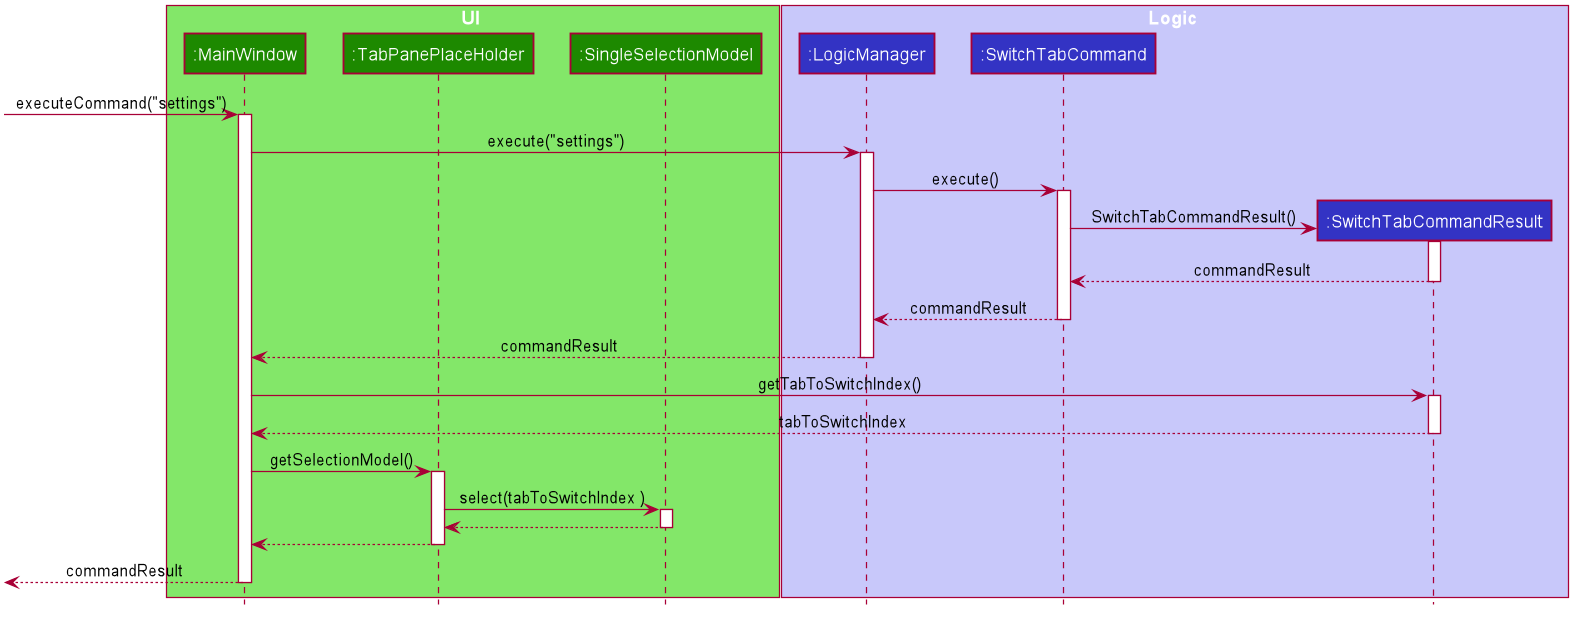
The mechanism of how SwitchTabCommand updates the Ui is described below.
Step 1. MainWindow executes the user input through logic and retrieves the SwitchTabCommandResult commandResult from Logic.
Step 2. MainWindow retrieves the tabToSwitchIndex from commandResult.
Step 3. MainWindow updates the tabToSwitchIndex tab through tabPanePlaceholder.
The following sequence diagram shows how SwitchTabCommand updates the tab in the Ui.
Statistics Feature
The Statistics feature allows the user to view information about their number of tasks completed and Pomodoro duration ran (in minutes) on a daily basis for the past CONSTANT_SIZE days.
CONSTANT_SIZE can be set to any number for any future developments. In our current implementation, we chose to store data for only the past 7 days to keep Statistics simple and intuitive for users.
|
Implementation
The Statistics feature is mainly supported by the Statistics class, which in turn is facilitated by the CustomQueue class. Its class diagram is given below.
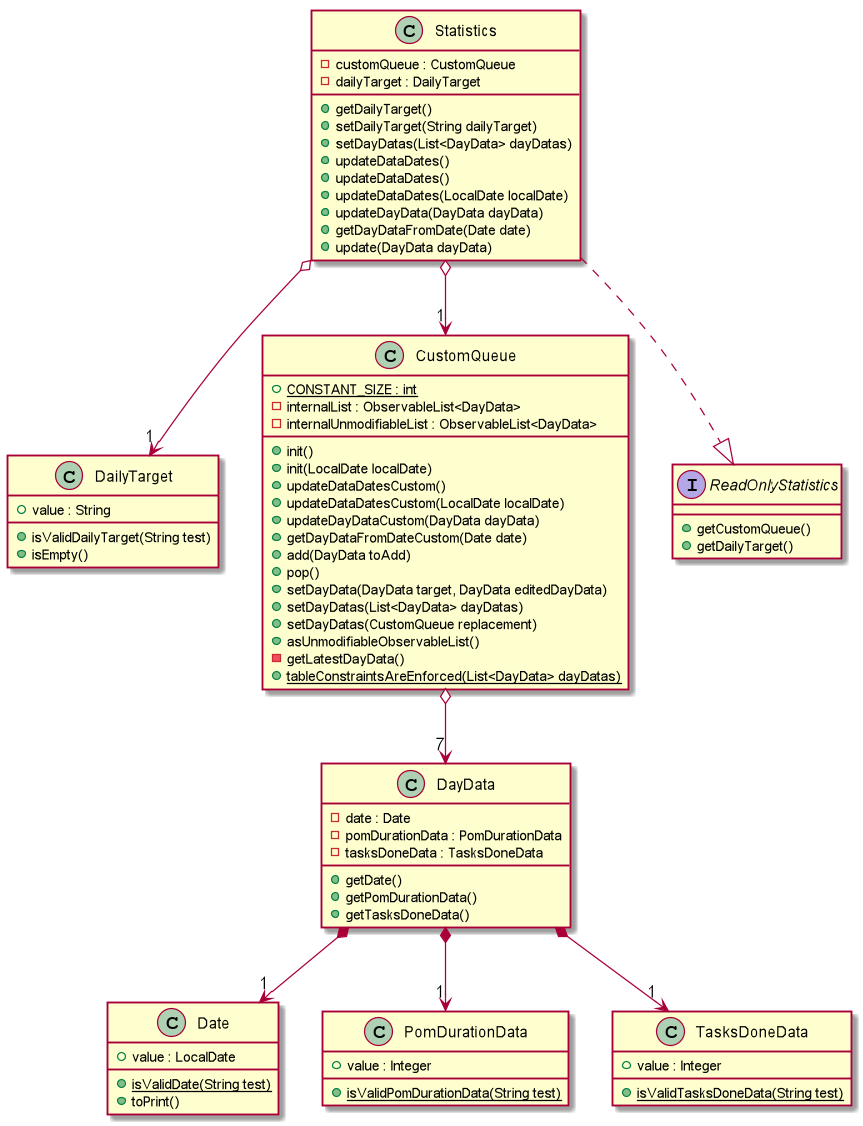
The CustomQueue class enforces the following constraints:
-
Size of
CustomQueuemust be ofCONSTANT_SIZEafter each method call throughStatistics. -
DayData dates in
CustomQueuemust be only 1 day apart between its elements, and sorted from oldest to latest date.
The CustomQueue class implements the following methods for other components to access or update its data:
-
Model#updateDataDatesStatistics- Updates data to current day while retaining stored data. -
Model#updatesDayDataStatistics- Replaces existing DayData in Statistics with new DayData of the same date. -
Model#getDayDataFromDateStatistics- Returns the DayData object from Statistics with the specified date.
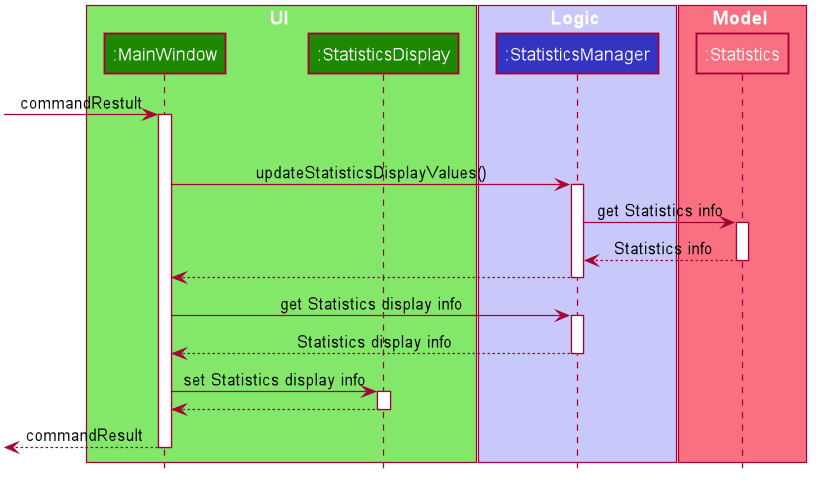
The Statistics feature does not support any explicit commands. Instead, Ui is updated and displayed when the SwitchTabCommand 'stats' is called. The mechanism of this behaviour is described below.
Step 1. MainWindow receives the SwitchTabCommandResult commandResult from Logic.
Step 2. MainWindow calls StatisticsManager#updateStatisticsDisplayValues() which retrieve the latest Statistics from Model and generates the display information.
Step 3. MainWindow then retrieves these display information from StatisticsManager and sets this information in StatisticsDisplay.
SwitchTabCommand also switches the focused tab to the Statistics tab to display the results to the user.
|
The following sequence diagram shows how the Statistics is updated to the display.
Design considerations
Aspect: Data structure to support Statistics
-
Alternative 1 (current choice): Use a list that stores a fixed number of DayData objects, with elements being strictly 1 day apart and sorted from oldest to latest date.
-
Pros: Lightweight, does not store unnecessary data. Easy to pass data to generate graphs. Systematic removal of outdated data.
-
Cons: Need to enforce constraints in methods.
-
-
Alternative 2: Use a list with elements sorted from oldest to latest date.
-
Pros: Easy to implement.
-
Cons: Harder to pass data to generate graphs. Need to handle outdated dates.
-
Aspect: when to update StatisticsDisplay
-
Alternative 1 (current choice): Update when the user runs the command to view Statistics
-
Pros: Easy to implement.
-
Cons: Progress can only be viewed at the Statistics tab.
-
-
Alternative 2: Update when any changes are made to Statistics.
-
Pros: In the event of future developments, any component of Statistics can be displayed at all times.
-
Cons: Need to keep track of all instances that can modify Statistics' values.
-
Appendix A: Non Functional Requirements
-
Should work on any mainstream OS as long as it has Java
11or above installed. -
Should be able to hold up to 1000 tasks without a noticeable sluggishness in performance for typical usage.
-
A user with above average typing speed for regular English text (i.e. not code, not system admin commands) should be able to accomplish most of the tasks faster using commands than using the mouse.
-
Graphics should not be offensive to any culture in any way.
-
Product should be fully functional with CLI alone.
-
Storage should be done in a human readable and editable format.
-
Commands should be user-friendly.